
Partnership proposal to EU tender:
Land use change and local / regional climate HORIZON-CL6-2024-CLIMATE-01-4
Highlights
InterEcoCenter (IEC) offers a partnership for the preparation of partnership proposals for the following tasks for the EU tenders:
Prepared proposals will be implemented on the basis of the EU Regulation on Land, Land Use Change and Forestry (LULUCF) 2018/841 EU and UN Policies, Instruments and Actions on "Development of Support for Monitoring and Reporting on GHG Emissions and Absorption from Land Use, Land Use Change and forestry".
The action aims to support the monitoring and reporting of greenhouse gas emissions and removals from land use, land use change and forestry in selected Member States (MS).
The legal basis is the new EU Regulation (EU) 2018/841 on greenhouse gas emissions and removals from land use, land-use change and forestry (LULUCF), which requires member states to improve their reporting systems. Article 18 (4) of this Regulation and Annex V (Part 3) of Regulation (EC) 2018/1999[2] require EU Member States to apply methodologies for monitoring land-use change according to IPCC approach 3 and at least 2 for key emission and absorption categories .
The results were obtained:
The proposed methodology for monitoring and validating land use patterns and changes at Member State and EU levels for the LUFF will be based on the use of CLC+ Copernicus satellite data components as a methodological framework. The action will assess what technical and definitional challenges need to be addressed to assess changes in carbon stock reporting under GHG Regulation (EU) 2018/841 based on the IPCC Guidelines for Land Use Categorization Assessment and Land Change Tracking.
The work will build on and complement previous EEA work, for example by integrating the results of previous and ongoing EEA work, such as the ETC/CA reports https://www.eionet.europa.eu/etc/all-etc-reports.
Link:
https://www.copernicus-user-uptake.eu/user-uptake/details/developing-support-for-monitoring-and-reporting-of-ghg-emissions-and-removals-from-land-use-land- use-change-and-forestry-73
Prepared proposals will be implemented on the basis of the EU Regulation on Land, Land Use Change and Forestry (LULUCF) 2018/841 EU and UN Policies, Instruments and Actions on "Development of Support for Monitoring and Reporting on GHG Emissions and Absorption from Land Use, Land Use Change and forestry".
The action aims to support the monitoring and reporting of greenhouse gas emissions and removals from land use, land use change and forestry in selected Member States (MS).
The legal basis is the new EU Regulation (EU) 2018/841 on greenhouse gas emissions and removals from land use, land-use change and forestry (LULUCF), which requires member states to improve their reporting systems. Article 18 (4) of this Regulation and Annex V (Part 3) of Regulation (EC) 2018/1999[2] require EU Member States to apply methodologies for monitoring land-use change according to IPCC approach 3 and at least 2 for key emission and absorption categories .
The results were obtained:
- Assessments were made from the reported GHG data from UNFCCC for LULUCF: data and corresponding values of GHG absorption from land use, land use change and forestry (LULUCF) for the possibility of integration into Copernicus services using the NUTS system.
- Measurement of the parameters and their corresponding values defined in the Copernicus service for their proportionality and compliance using the NUTS classification system with GHG data from UNFCCC using NUTS classification to identify their connections and data integration: carbon stocks and related emissions and absorption with and without LULUCF;
- Little-known parameters for greenhouse gas data are proposed for research with the application of their products of Copernicus services data to prepare for the study of new assessment methods and the development of greenhouse gas monitoring with existing datasets for the entire EU;
- Reconciliation of data by year between GHG data from UNFCCC and long-term time data received in Copernicus services using new products that are correlated and adjusted with the values of emissions and absorption of greenhouse gases and carbon.
The proposed methodology for monitoring and validating land use patterns and changes at Member State and EU levels for the LUFF will be based on the use of CLC+ Copernicus satellite data components as a methodological framework. The action will assess what technical and definitional challenges need to be addressed to assess changes in carbon stock reporting under GHG Regulation (EU) 2018/841 based on the IPCC Guidelines for Land Use Categorization Assessment and Land Change Tracking.
The work will build on and complement previous EEA work, for example by integrating the results of previous and ongoing EEA work, such as the ETC/CA reports https://www.eionet.europa.eu/etc/all-etc-reports.
Link:
https://www.copernicus-user-uptake.eu/user-uptake/details/developing-support-for-monitoring-and-reporting-of-ghg-emissions-and-removals-from-land-use-land- use-change-and-forestry-73
Below is the Implementation Report consisting of a description of the tasks from the tender announcement (Task #...) and the process of their implementation (Execution of tasks...) from LULUCF, confirming the results obtained:
Implementation Report
Task #1
..............
Expected Outcome:
Projects results are expected to contribute to all of the following expected outcomes:
The execution of Task #1
..............
Expected Outcome:
Projects results are expected to contribute to all of the following expected outcomes:
- Solutions are made available for understanding, modelling and optimising the relationships between net removals from Land Use, Land Use Change and Forestry (LULUCF) and biogenic emissions from the agriculture sector at local / regional level;
The execution of Task #1
We use the following data service with data for LULUCF:
|
1.) Process and meetings/Transparency and Reporting / Reporting and review/Transparency data and tools/Greenhouse Gas Data" of UNFCCC secretariat/UN Climate Change is the United Nations which supports the global response to the threat of climate change (Taking into account the data for LULUCF).
|
|
2.) Data and cartographic material presented by EU Emissions Database for Global Atmospheric Research (EDGAR).
|
|
3.)Emissions scenario database of the European Scientific Advisory Board on Climate Change v2.0 hosted by IIASA for Land Use, Land Use Change and Forestry (Taking into account the data for LULUCF). The research theme Scenario Services & Scientific Software maintains the Scenario Explorer infrastructure and develops open-source tools for scenario analysis and data visualization. This work facilitates model comparison projects and the dissemination of research output in stakeholder-focused formats. It fosters the adoption of the FAIR principles for open science and reproducible research at IIASA and in the wider community.
|
CLC+: a new generation Land Information System for Europe
Policy context
The European Environment Agency (EEA), in its capacity of the coordinator of the CLMS, has started the development and implementation of new land cover and land use products and applications, under the CLC+ name. CLC+ complements and extents the CLMS product portfolio to better align with increasing requirements for European Land Cover and Land Use monitoring and reporting obligations.
The new concept was specified in the cooperation between the Eionet network and in particular the EAGLE expert group, and the stakeholders in the European Environment Agency. The process was supported by open user consultations.
CLC+ will become a part of the new European baseline for European Land Cover and Land Use monitoring for the decade to come, and the CLC+ Core database and web application (one of the components of CLC+) will allow to derive tailored products (so called instances) for support to key EU policy needs through the full policy cycle, as well as to specific needs as of the stakeholders in the EU Member States. Important first use-cases for CLC+ Core instances are around monitoring, reporting and validation to support the implementation of the Regulation on the Inclusion of Greenhouse Gas emissions and Removals from Land use, Land Use Change and Forestry (LULUCF).
Concept and components of CLC+CLC+ has two components:
Reference: CLC+: a new generation Land Information System for Europe https://land.copernicus.eu/en/products/clc-a-new-generation-land-information-system-for-europe
--------------------------------------------------------------------------------------------------------------------------------------------------------------------------------------
..........................
Task #2
...............
Project activities should:
The execution of Task #2
We use data analysis and their cartographic representation for the following services and products:
.........................
Task #3
...............
Topic destination
Land, ocean and water for climate action (2023/24)
...............
The main outcomes expected are an improved understanding of the ocean’s role in the Earth’s climate system, resulting in the closing of the research gaps on ocean essential climate variables and improved ocean models for seasonal to decadal forecasting at local and regional scales. This in turn will support decision-making aimed at preserving the integrity of the ocean and aquatic ecosystems and the polar Regions, through a better understanding of the drivers of change and of emerging threats, including tipping points. The ocean is also a large storage system for the global reservoirs of climate-regulating factors, particularly carbon. R&I will advance knowledge innovations to develop ocean-based solutions/mitigation options, helping to close the emissions gap and stop ocean acidification and prevent the consequent biodiversity losses.
............
The execution of the Task #3
The main expected results are an improved understanding of the role of the ocean in the Earth's climate system, which will lead to the elimination of research gaps in important ocean climate variables and the improvement of ocean models for seasonal and decadal forecasting at local and regional scales. We offer a proposal for making decisions aimed at preserving the integrity of: 1.) the ocean as a large storage system of global reservoirs of climate-regulating factors for carbon, 2.) wetlands 2.) polar regions. Research and innovation streams will be developed that will drive innovation in knowledge to develop ocean mitigation solutions/options, helping to close the emissions gap, halt ocean acidification and prevent further biodiversity loss.
We use data analysis and their GIS cartographic representation for the following services and products:
Task #4
..........
The following blue carbon ecosystem developments could be envisaged:
exploring, preserving, restoring or even creating new natural habitats, and providing solutions to strengthen resilience and protection of EU coastal areas against climate change;
..........
The execution of the Task #4
We use data analysis and their GIS cartographic representation for the following Copernicus packages: services, products, models and variables:
Note: A detailed description of the execution the Task #4 is given below.
..........
IEC can prepare the next:
The proposals for action to implement the following impacts that will contribute to climate action on land, including forests, grasslands, arable land and wetlands, for effective monitoring, assessment, modeling and data and forecasting decision support systems, related to climate change impacts, mitigation and adaptation potential to provide solutions to address existing and new threats and support decision-making in climate change policy, climate change mitigation and adaptation at the European and global levels with a description of the result. For this, the following services, tools, scenarios, and models authorized by the EU climate law and Regulation (EU) 2018/841 for land use, forestry, and agriculture.
The European Environment Agency (EEA), in its capacity of the coordinator of the CLMS, has started the development and implementation of new land cover and land use products and applications, under the CLC+ name. CLC+ complements and extents the CLMS product portfolio to better align with increasing requirements for European Land Cover and Land Use monitoring and reporting obligations.
The new concept was specified in the cooperation between the Eionet network and in particular the EAGLE expert group, and the stakeholders in the European Environment Agency. The process was supported by open user consultations.
CLC+ will become a part of the new European baseline for European Land Cover and Land Use monitoring for the decade to come, and the CLC+ Core database and web application (one of the components of CLC+) will allow to derive tailored products (so called instances) for support to key EU policy needs through the full policy cycle, as well as to specific needs as of the stakeholders in the EU Member States. Important first use-cases for CLC+ Core instances are around monitoring, reporting and validation to support the implementation of the Regulation on the Inclusion of Greenhouse Gas emissions and Removals from Land use, Land Use Change and Forestry (LULUCF).
Concept and components of CLC+CLC+ has two components:
- a geospatial data component: CLC+ Backbone, producing and updating geospatial land cover datasets.
The CLC+ Backbone component produces a detailed wall to wall geometric vector reference layer with 18 basic thematic classes and a 11-class 10m spatial resolution raster product. The products are fully compliant with the EAGLE data model and nomenclature, and can be used as input data for the CLC+ Core database. Detailed product specifications can be found here. Only the CLC+ Backbone raster product for the 2018 reference is available publicly; - a database/ web application component: CLC+ Core, providing the tool to create tailor-made 100 m grid products (instances) by combining available data in new ways.
The CLC+ Core component will deliver a consistent multi-use grid-based land cover and land use hybrid data repository. By implementing a flexible data handling approach, CLC+ Core will incorporate existing and future European CLMS products and various national land cover and land use products using a standardized integration approach in line with the EAGLE data model.
Land use and land cover data from the CLMS, countries and other sources can be ingested into CLC+ Core, and individual classes will be captured as elements of the EAGLE data model. These elements are separated into land cover components (LCC), land use attributes (LUA) and further characteristics (CH). - The main use case for CLC+ Core is to derive tailor made land cover and land use products (so called "Instances"), on a 100 m grid level, based on a on-demand combination of available (EAGLE harmonized) land cover and land use information. This allows to combine previously non harmonized datasets in new ways, in particular land cover information coming from the CLMS products with specific land use information from the countries. Currently, the CLC+ Core application is limited to the participating countries in the EU.
Reference: CLC+: a new generation Land Information System for Europe https://land.copernicus.eu/en/products/clc-a-new-generation-land-information-system-for-europe
--------------------------------------------------------------------------------------------------------------------------------------------------------------------------------------
..........................
Task #2
...............
Project activities should:
- Analyse, model and project the impact of past, present and future land use and land use change on the local and regional evolution of the climate, including as appropriate the use of remote sensing technologies (Copernicus) combined with innovative processing and AI
The execution of Task #2
We use data analysis and their cartographic representation for the following services and products:
- CLC+Backbone 2018 (raster 10 m), Europe, 3-yearly
- Forest Type 2018 (raster 10 m and 100 m), Europe, 3-yearly /Copernicus Land Monitoring Service.
- Land Cover 2019 (raster 100 m), global, yearly – version 3/Copernicus Land Monitoring Service.
- Tree Cover Density 2018 (raster 10 m and 100 m), Europe, 3-yearly/Copernicus/Copernicus Land Monitoring Service
- Grassland 2018 (raster 10 m and 100 m), Europe, 3-yearly/Copernicus Land Monitoring Service
- Dominant Leaf Type 2018 (raster 10 m), Europe, 3-yearly/ Copernicus Land Monitoring Service
- Natura2000/N2K Land Cover/Land Use Change 2012-2018 (vector), Europe, 6-yearly
- CORINE Land Cover Change 2012-2018 (vector/raster 100 m), Europe, 6-yearly./Copernicus Land Monitoring Services.
.........................
Task #3
...............
Topic destination
Land, ocean and water for climate action (2023/24)
...............
The main outcomes expected are an improved understanding of the ocean’s role in the Earth’s climate system, resulting in the closing of the research gaps on ocean essential climate variables and improved ocean models for seasonal to decadal forecasting at local and regional scales. This in turn will support decision-making aimed at preserving the integrity of the ocean and aquatic ecosystems and the polar Regions, through a better understanding of the drivers of change and of emerging threats, including tipping points. The ocean is also a large storage system for the global reservoirs of climate-regulating factors, particularly carbon. R&I will advance knowledge innovations to develop ocean-based solutions/mitigation options, helping to close the emissions gap and stop ocean acidification and prevent the consequent biodiversity losses.
............
The execution of the Task #3
The main expected results are an improved understanding of the role of the ocean in the Earth's climate system, which will lead to the elimination of research gaps in important ocean climate variables and the improvement of ocean models for seasonal and decadal forecasting at local and regional scales. We offer a proposal for making decisions aimed at preserving the integrity of: 1.) the ocean as a large storage system of global reservoirs of climate-regulating factors for carbon, 2.) wetlands 2.) polar regions. Research and innovation streams will be developed that will drive innovation in knowledge to develop ocean mitigation solutions/options, helping to close the emissions gap, halt ocean acidification and prevent further biodiversity loss.
We use data analysis and their GIS cartographic representation for the following services and products:
- Copernicus/Copernicus Marine Service/Arctic Sea
- Copernicus/Copernicus Marine Service/Atlantic: Iberia-Biscay-Ireland
- Copernicus/Copernicus Marine Service/Atlantic: NW European Shelf
- Copernicus/Copernicus Marine Service/Atlantic: North
Task #4
..........
The following blue carbon ecosystem developments could be envisaged:
exploring, preserving, restoring or even creating new natural habitats, and providing solutions to strengthen resilience and protection of EU coastal areas against climate change;
..........
The execution of the Task #4
We use data analysis and their GIS cartographic representation for the following Copernicus packages: services, products, models and variables:
- Surface partial pressure of carbon dioxide in sea water spco2/Global Ocean Surface Carbon/Copernicus Marine Service.
- Surface downward mass flux of carbon dioxide expressed as carbon fgco2/Global Ocean Surface Carbon/Copernicus Marine Service.
- Surface downward mass flux of carbon dioxide expressed as carbon fgco2/Global Ocean Surface Carbon/Copernicus Marine Service.
- Coastal Zones Land Cover/Land Use Change 2012-2018/Copernicus Land Monitoring Services.
- Coastal Zones Land Cover/Land Use 2018/ Copernicus Land Monitoring Services:
- Coastal Zones Land Cover/Land Use 2012/Copernicus Land Monitoring Services.
Note: A detailed description of the execution the Task #4 is given below.
..........
IEC can prepare the next:
The proposals for action to implement the following impacts that will contribute to climate action on land, including forests, grasslands, arable land and wetlands, for effective monitoring, assessment, modeling and data and forecasting decision support systems, related to climate change impacts, mitigation and adaptation potential to provide solutions to address existing and new threats and support decision-making in climate change policy, climate change mitigation and adaptation at the European and global levels with a description of the result. For this, the following services, tools, scenarios, and models authorized by the EU climate law and Regulation (EU) 2018/841 for land use, forestry, and agriculture.
Explanations regarding the execution of Task #1,2,3,4
List of services, tools, scenarios and models with short descriptions with screenshots of the use and execution of tasks is attached below in the text:
We use the UNFCCC /UN Climate Change secretariat tool, which presents the CO2 accounting system for each country from 1999 to 2021 https://di.unfccc.int/flex_non_annex1, which allows you to perform calculations and obtain aggregated data on CO2 conservation and emissions in on a regional scale.
Explanations regarding the execution of Task #1
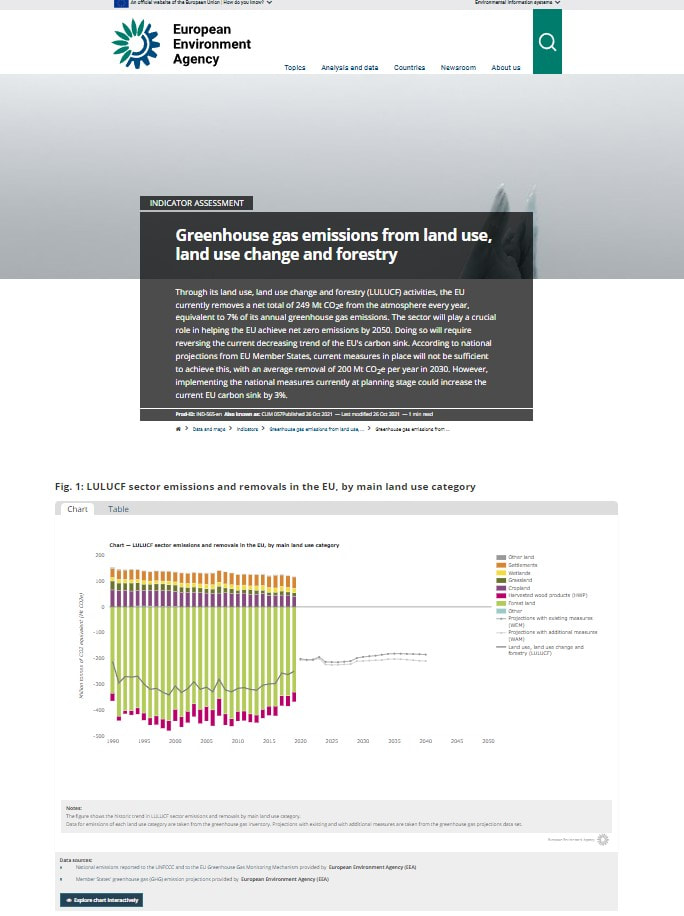
In 2019, a total of 249 Mt CO2e net emissions were removed by the EU LULUCF sector, equivalent to 7% of total EU GHG emissions resulting from carbon sequestration by forests and carbon storage in harvested wood products. EU CO2 emissions have been decreasing over the past 10 years, mainly due to lower carbon absorption by aging forests and increased deforestation rates. It is necessary to identify and monitor areas with the manifestation of natural disturbances: wind gusts, forest fires, droughts and outbreaks of bark beetles, which cause most of the interannual fluctuations of time series and their increased frequency of manifestation, which affected the long-term trend. Declining rates of net growth in forest area have also contributed to the decline in net extraction over the past decade. All other LULUCF activities: arable land, including managed organic soils, pastures, wetlands and settlements are sources of emissions at EU level. After 2030, the proposal sets the path to a climate-neutral EU land sector by 2035, combining emissions from agriculture with net absorption from GHGs.
Estimating levels of emissions and absorption of greenhouse gases (GHG) is an important element of efforts to achieve the goal of the Convention on Climate Change (UNFCCC). Thе web page provides access to the most recent data on national greenhouse gas emissions and removals as Greenhouse Gas Emissions Data - UNFCCC. The UNFCCC Greenhouse Gas Emissions Data Interface, which provides access to the latest greenhouse gas emissions data provided by countries that are Parties to the Convention on Climate Change:
Two sources of data on greenhouse gas emissions that have data for LULUCF are presented:
Description of the elements of each of the greenhouse gas data interface module #1:
1.Time Series - Annex; 2.) Greenhouse Gas Inventory Data - Detailed data by Party; 3.) Greenhouse Gas Inventory Data - Comparison by Category 4.)Greenhouse Gas Inventory Data - Comparison by Gas; 5.) GHG Profiles - Annex I; 6.)Global map - Annex I ; 7.) Greenhouse Gas Inventory Data - Flexible Queries Annex I Parties; 8.) Greenhouse Gas Inventory Data - User defined indicators Annex I Parties.
Two sources of data on greenhouse gas emissions that have data for LULUCF are presented:
- The UNFCCC Data Interface provides a vast amount of data. Data can be displayed for individual Parties or groups of Parties, for different greenhouse gases or for their sum and with varying degrees of detail. To find the exact greenhouse gas emissions data required, the user is encouraged to consult the table below, which compares typical user requirements to the data availability on this site.
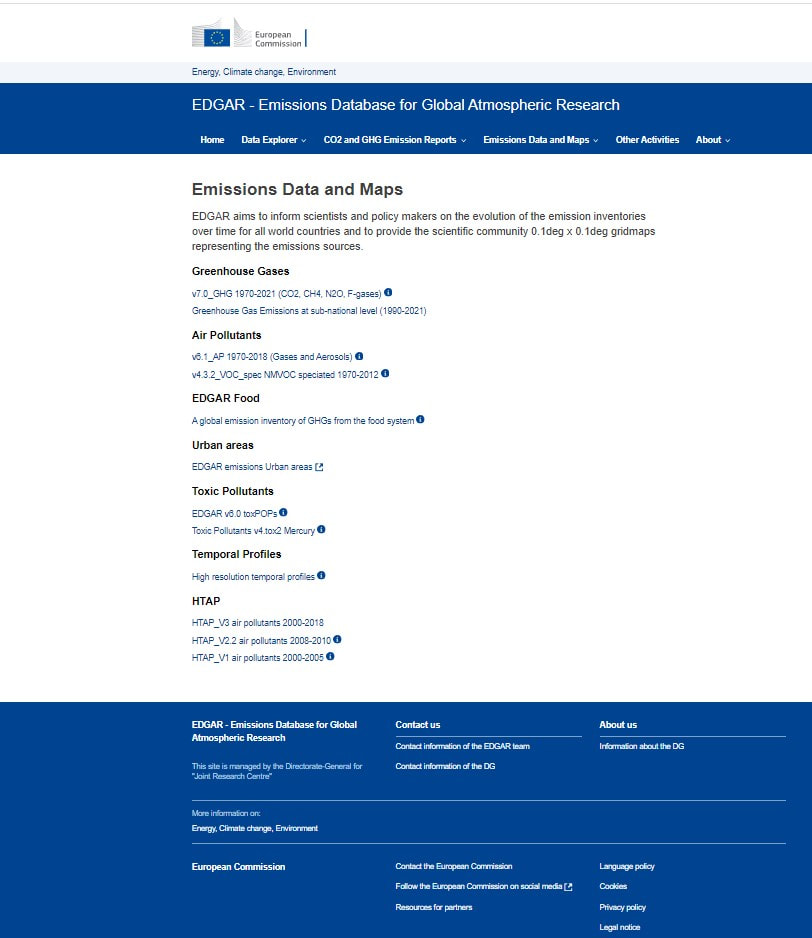
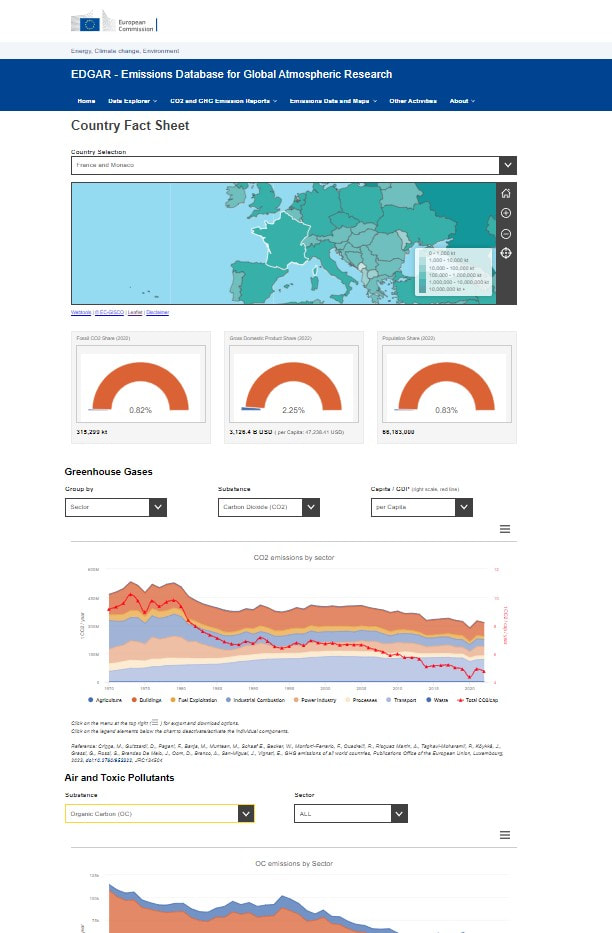
- Non-UNFCCC Greenhouse Gas Emissions Data: This page links to websites of various organizations that also collect, estimate and/or disseminate data on greenhouse gas emissions/removals that represented by EU Emissions Database for Global Atmospheric Research (EDGAR). EDGAR is a multipurpose, independent, global database of anthropogenic emissions of greenhouse gases and air pollution on Earth. EDGAR provides independent emission estimates compared to what reported by European Member States or by Parties under the United Nations Framework Convention on Climate Change (UNFCCC), using international statistics and a consistent IPCC methodology.EDGAR provides both emissions as national totals and gridmaps at 0.1 x 0.1 degree resolution at global level, with yearly, monthly and up to hourly data.
Description of the elements of each of the greenhouse gas data interface module #1:
1.Time Series - Annex; 2.) Greenhouse Gas Inventory Data - Detailed data by Party; 3.) Greenhouse Gas Inventory Data - Comparison by Category 4.)Greenhouse Gas Inventory Data - Comparison by Gas; 5.) GHG Profiles - Annex I; 6.)Global map - Annex I ; 7.) Greenhouse Gas Inventory Data - Flexible Queries Annex I Parties; 8.) Greenhouse Gas Inventory Data - User defined indicators Annex I Parties.
1.The UNFCCC Data Interface
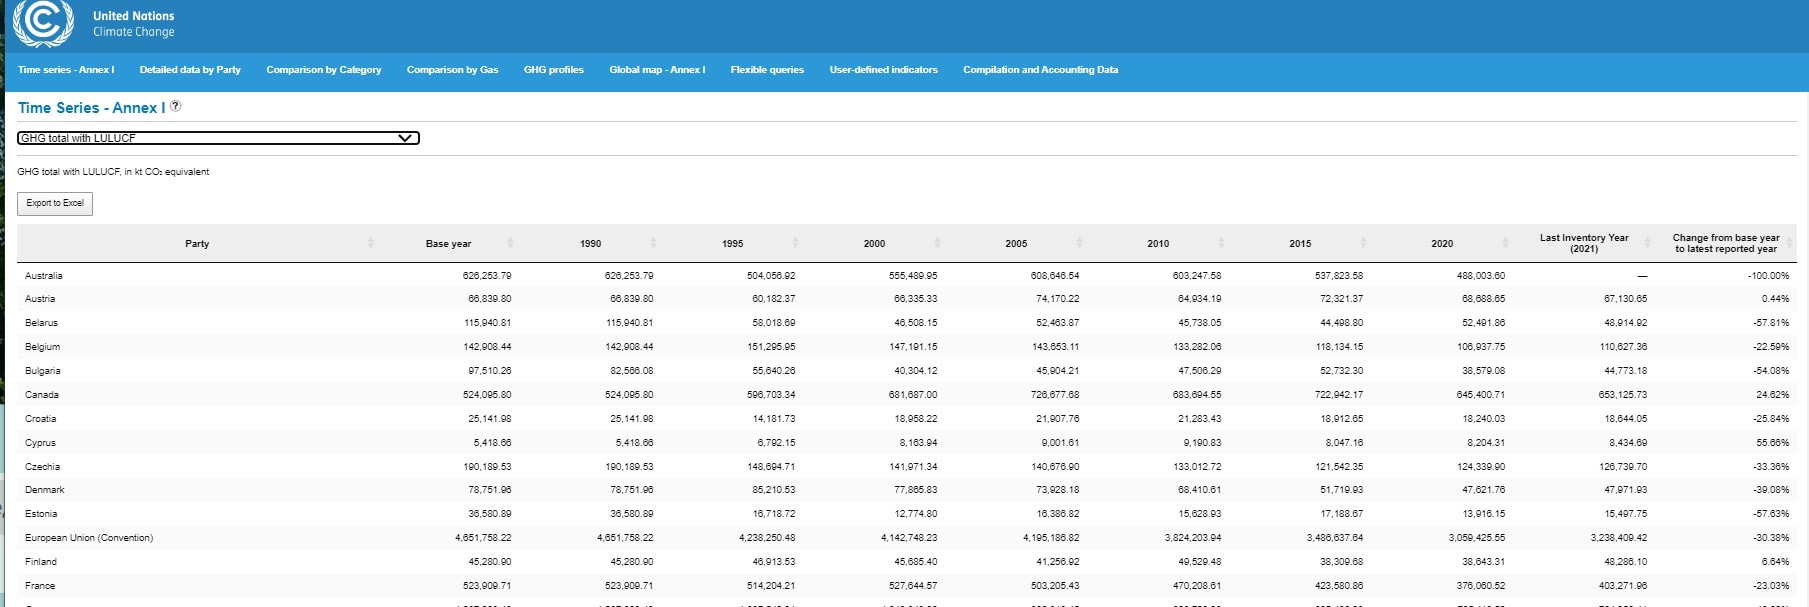
Fig. Time Series - Annex I for France with LULUCF
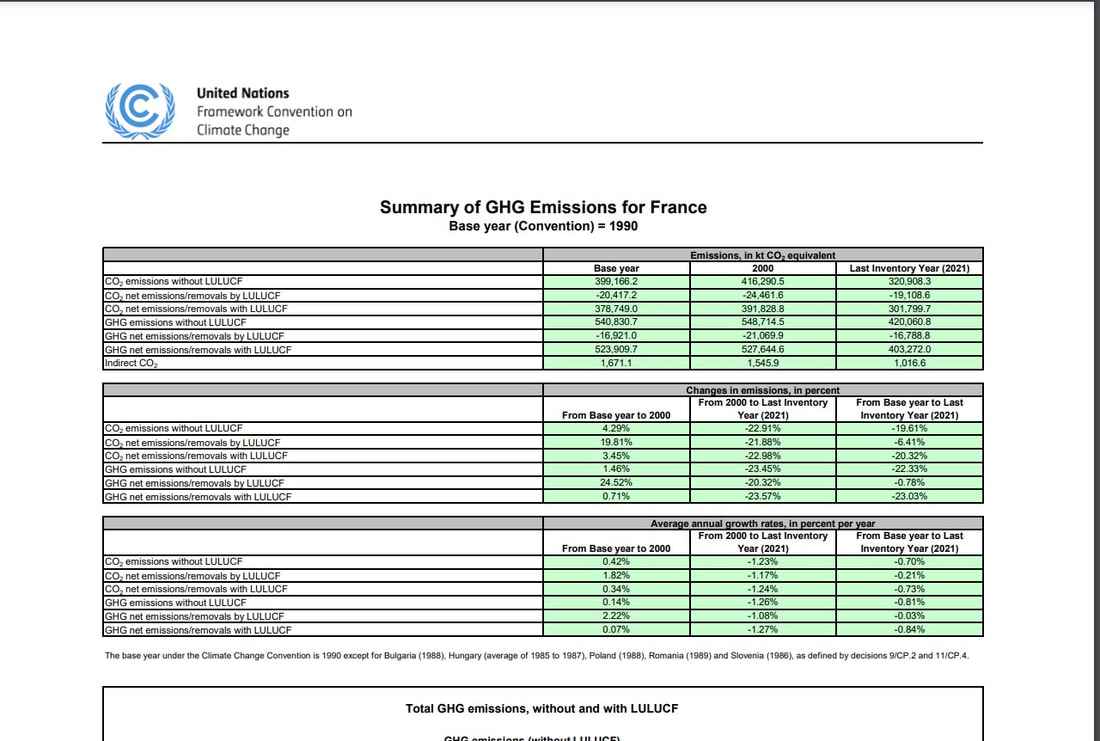
Fig.Summary of GHG emissions from UNFCCC for France
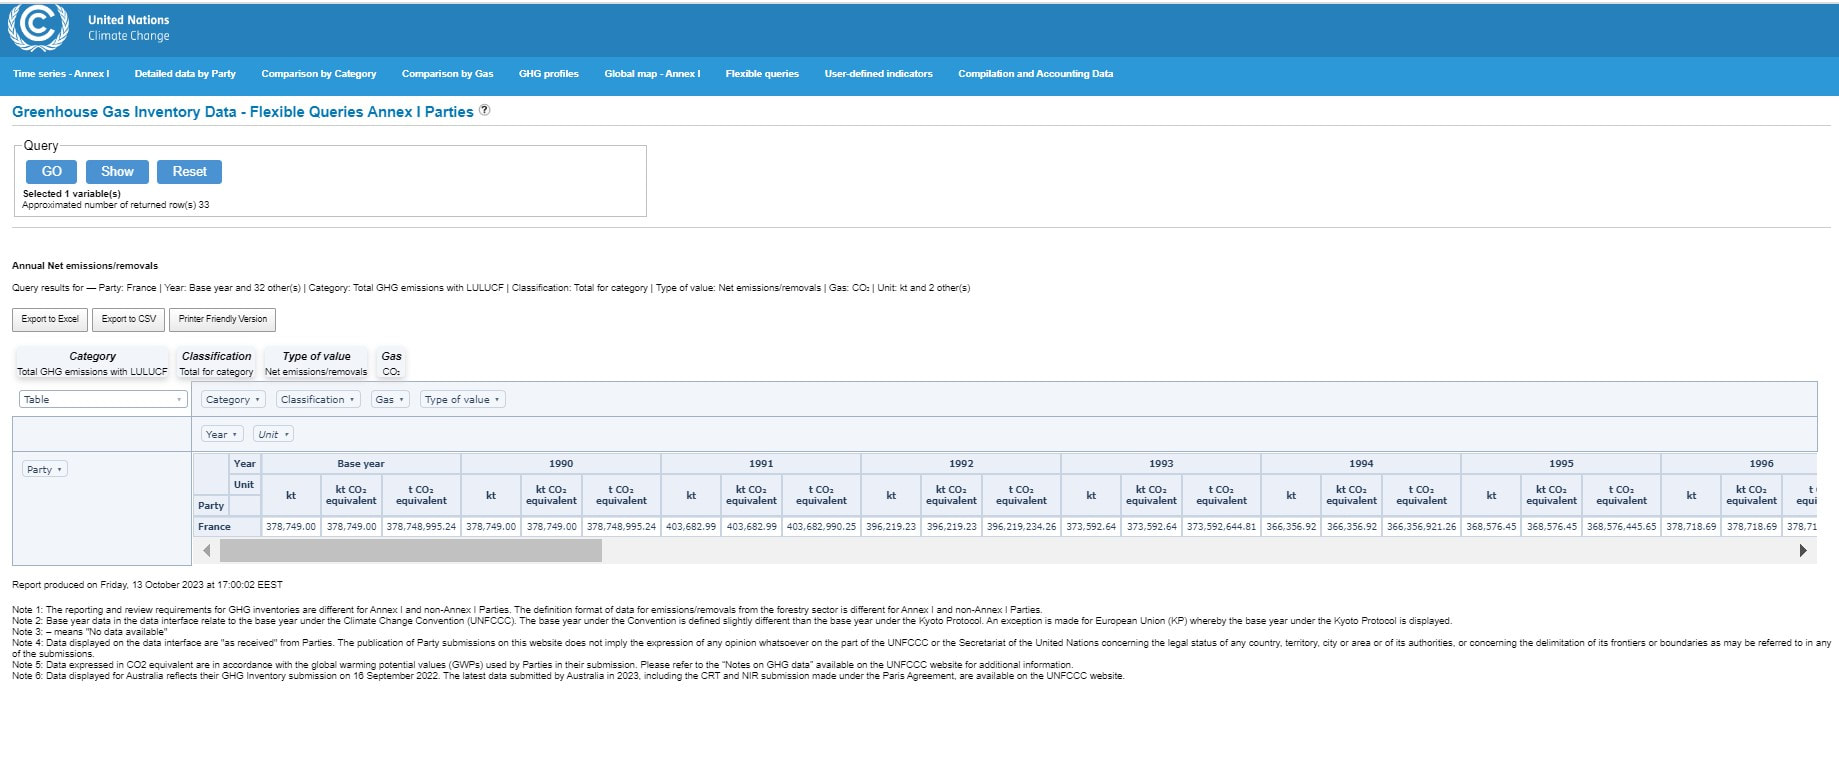
Fig. Greenhouse Gas Inventory Data - Detailed data by Party for France by years
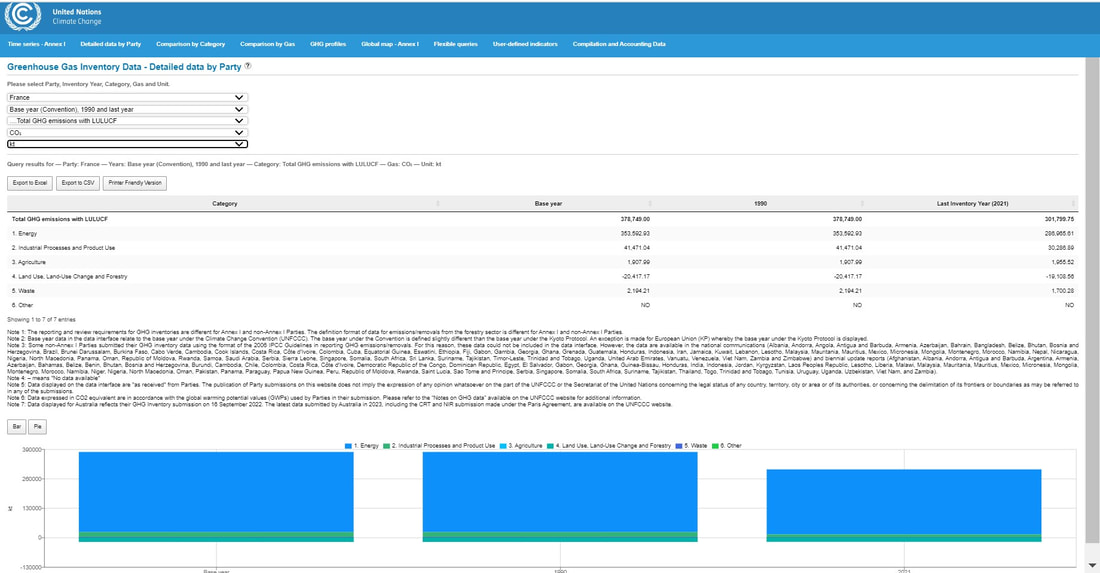
Fig. Greenhouse Gas Inventory Data - Detailed data by Party for France by categories and LULUCF
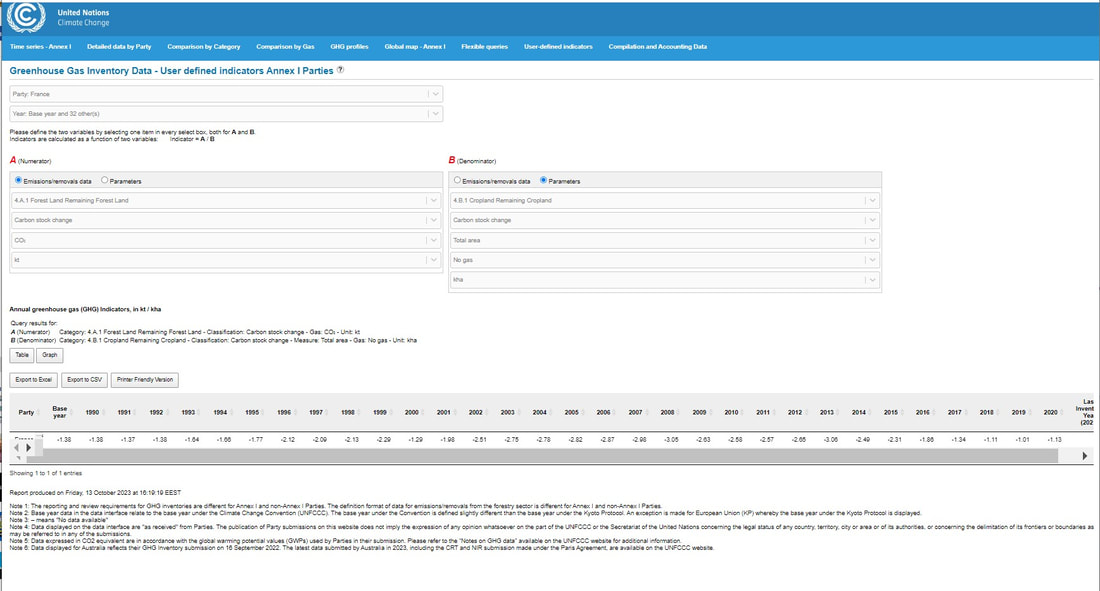
Fig.Greenhouse Gas Inventory Data - User defined indicators Annex I Parties for France
2.EU Emissions Database for Global Atmospheric Research (EDGAR).

3. IAMC 1.5°C Scenario Explorer hosted by IIASA release 2.0
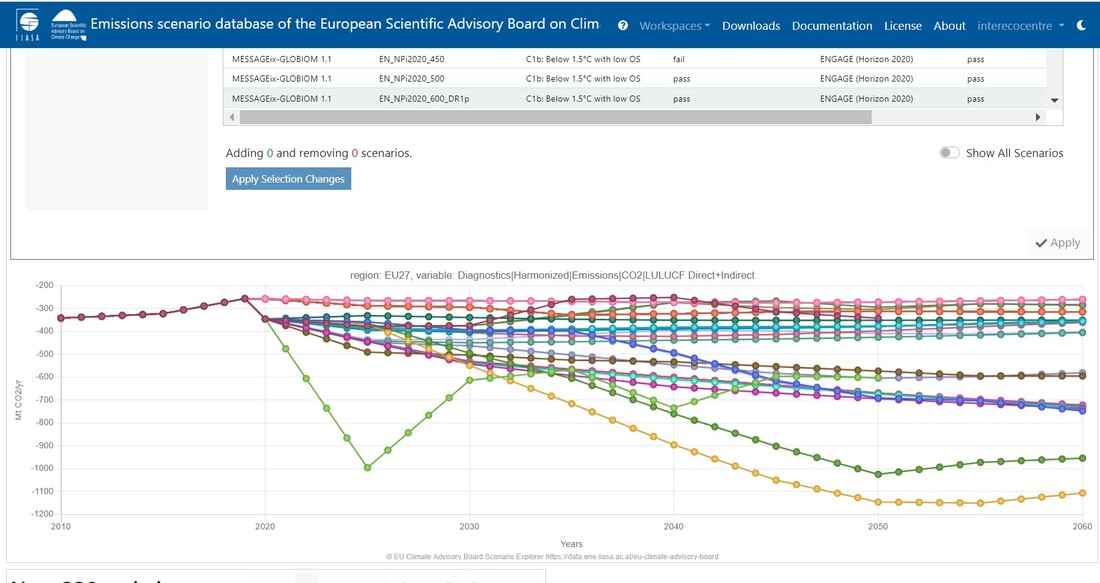
This Scenario Explorer holds emissions scenario data that was submitted to the European Scientific Advisory Board on Climate Change (ESABCC) in response to this Call for Contributions of emissions scenario data that can support its work in advising the EU on policy measures, climate targets and greenhouse gas budgets. The ESABCC provides EU institutions with a science-based estimate of a 2040 climate target and an EU greenhouse gas emissions budget for the period 2030-2050. The analysis is supported by quantitative, model-based scenarios to outline possible pathways and related overarching policy choices to achieve the necessary emission reductions.
These scenarios are made accessible via this public Scenario Explorer hosted by IIASA to facilitate transparency, reproducibility, and reuse of the work.
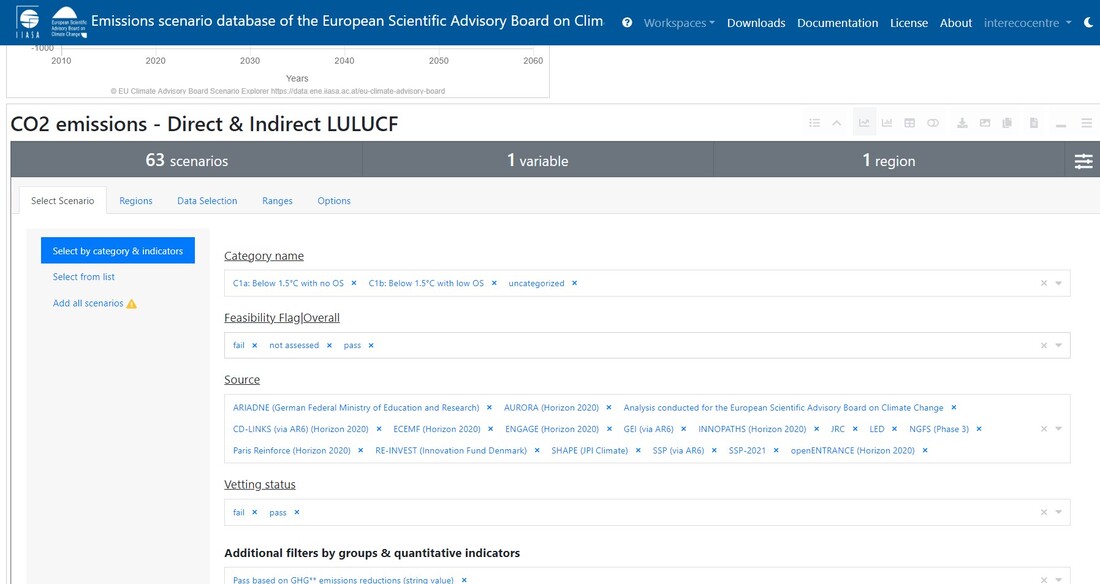
3.Emissions scenario database of the European Scientific Advisory Board on Climate Change v2.0
Emissions scenario database of the European Scientific Advisory Board on Climate Change v2.0 hosted by IIASA for Land Use, Land Use Change and Forestry (Taking into account the data for LULUCF). The research theme Scenario Services & Scientific Software maintains the Scenario Explorer infrastructure and develops open-source tools for scenario analysis and data visualization. This work facilitates model comparison projects and the dissemination of research output in stakeholder-focused formats. It fosters the adoption of the FAIR principles for open science and reproducible research at IIASA and in the wider community.
Fig.The analysis is supported by quantitative, model-based scenarios to outline possible pathways and related overarching policy choices to achieve the necessary emission reductions.
Explanations regarding the execution of Task #2
1.Forest Type 2018 (raster 10 m and 100 m), Europe, 3-yearly /Copernicus Land Monitoring Service.
The High Resolution Layer (HRL) Forest Type (FTY) 2018 at 100 m spatial resolution is an aggregated version of the FTY layer at 10 m spatial reoslution, fully aligned with the EEA reference grid, and provides a forest classification with 3 thematic classes (all non-forest areas / broadleaved forest / coniferous forest). The dataset is provided as a full mosaic covering EEA38 countries and the United Kingdom.
The production of the High Resolution forest layers was coordinated by the European Environment Agency (EEA) in the frame of the EU Copernicus programme.
The high resolution forest product consists of three types of (status) products and additional change products. The status products are available for the 2012, 2015 and 2018 reference years: 1. Tree cover density providing level of tree cover density in a range from 0-100%; 2. Dominant leaf type providing information on the dominant leaf type: broadleaved or coniferous; 3. A Forest type product. The forest type product allows to get as close as possible to the FAO forest definition. In its original (20m) resolution it consists of two products: 1) a dominant leaf type product that has a MMU of 0.5 ha, as well as a 10% tree cover density threshold applied, and 2) a support layer that maps, based on the dominant leaf type product, trees under agricultural use and in urban context (derived from CLC and high resolution imperviousness 2009 data). For the final 100m product trees under agricultural use and urban context from the support layer are removed. The high resolution forest change products comprise a simple tree cover density change product for 2012-2015 (% increase or decrease of real tree cover density changes).
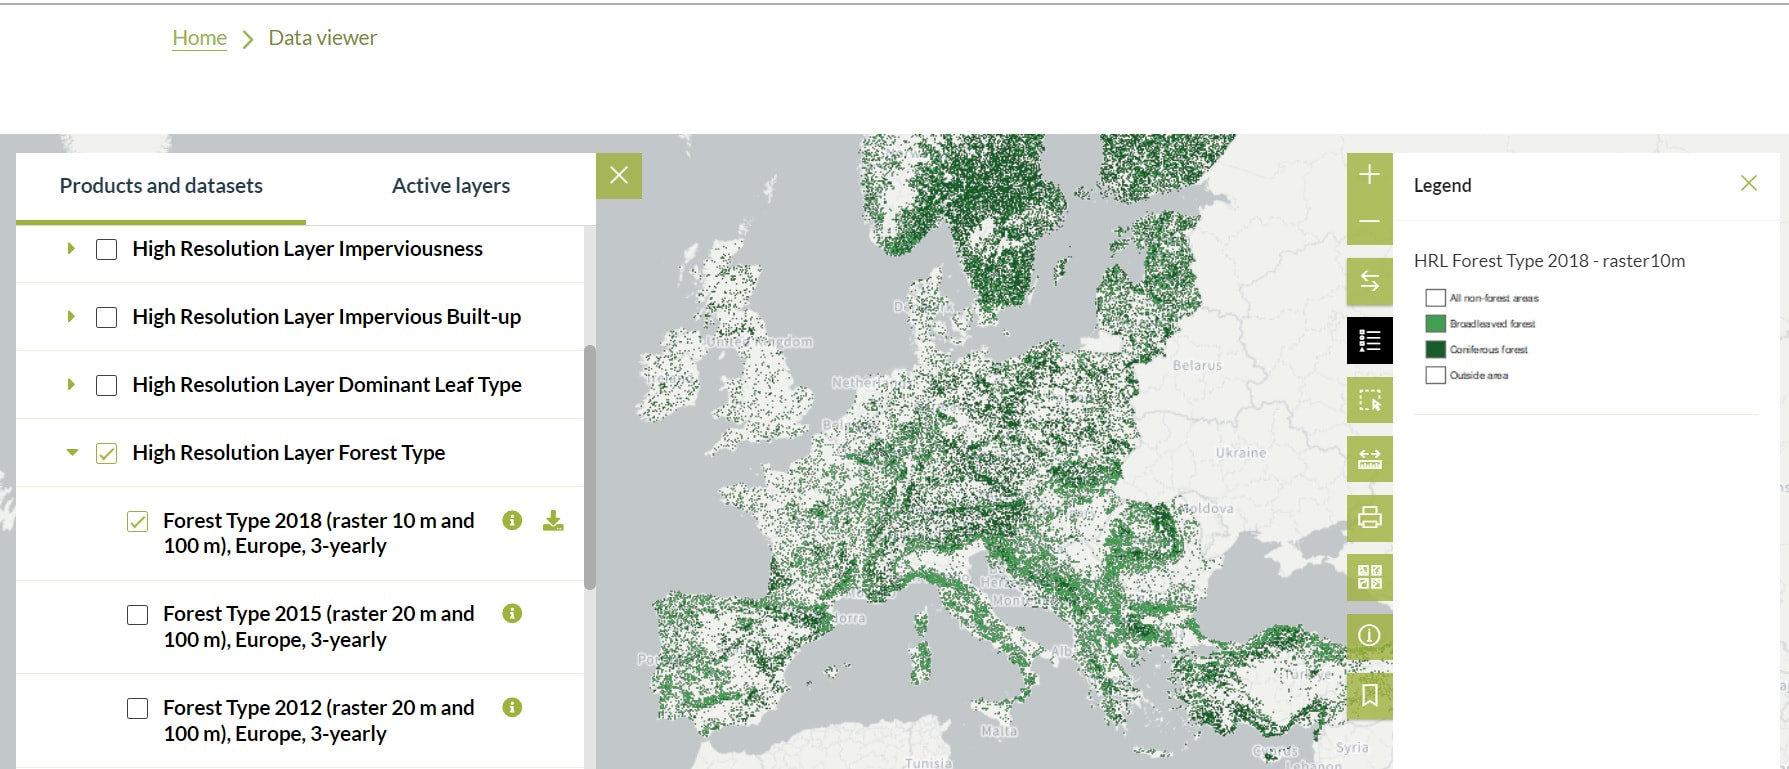
Fig.Forest Type 2018 (raster 10 m and 100 m), Europe, 3-yearly /Copernicus Land Monitoring Service.
2.Land Cover 2019 (raster 100 m), global, yearly – version 3/
he version 3.0 annual 100m land cover classes were mapped with high temporal stability across years and an overall mapping accuracy just over 80% (80.6% in 2015, 80.3% in 2019), when compared to the 28K independent validation points. The statistical validation meets the CEOS Land Product Validation Stage 4 requirements.The updated 2015 classification map shows slightly higher accuracy than the previous version (v2.0.2) and improvements in characterizing forest, cropland and permanent water classes. Spatial accuracy assessment for three aggregated classes (forest, crops and natural vegetation) against a set of over 200K independent validation points revealed a high level of accuracy in different regions of the world and highlighted areas for further improvement.Validation dataset for the land cover classification of reference year 2015, per continent. A first statistical assessment of generic land cover changes between 2015 and 2018 was done to gain understanding in the consistency of and differences between the annual maps, at global and continental scales. This assessment revealed that no-change pixels were mapped with high accuracy (99.6%) and cover changes are more likely committed than omitted.
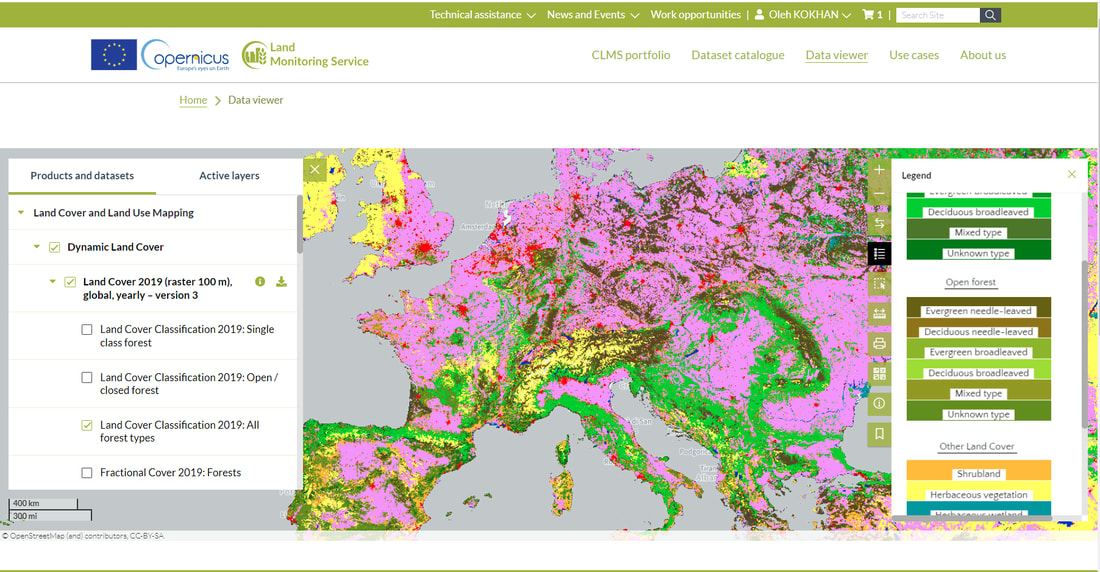
Fig.Land Cover 2019 (raster 100 m), global, yearly – version 3/
3.Tree Cover Density 2018 (raster 10 m and 100 m), Europe, 3-yearly
This metadata refers to the HRL Forest 2018 primary status layer Tree Cover Density (TCD). The TCD raster product provides information on the proportional crown coverage per pixel at 10m spatial resolution and ranges from 0% (all non-tree covered areas) to 100%, whereby Tree Cover Density is defined as the "vertical projection of tree crowns to a horizontal earth’s surface“. The production of the High Resolution Forest layers was coordinated by the European Environment Agency (EEA) in the frame of the EU Copernicus programme.
The HRL Forest product consists of 3 types of (status) products and additional change products. The status products are available for 2012, 2015, and 2018 reference years:
1. Tree cover density (TCD) (level of tree cover density in a range from 0-100%)
2. Dominant leaf type (DLT) (broadleaved or coniferous majority)
3. Forest type product (FTY). The forest type product allows to get as close as possible to the FAO forest definition. In its original (10m (2018) / 20m (2012, 2015)) resolution it consists of two products: a dominant leaf type product that has a MMU of 0.5 ha, as well as a 10% tree cover density threshold applied, and 2) a support layer that maps (now only available on demand), based on the dominant leaf type product, trees under agricultural use and in urban context (derived from CLC and imperviousness 2009 data). For the final 100 m product trees under agricultural use and urban context from the support layer are removed.
NEW for 2018: the 10m 2018 reference year FTY product now also has the agricultural/urban trees removed. In the past this was done only for the 100m product, now it is consistently applied for both the 10m and the 100m FTY products.
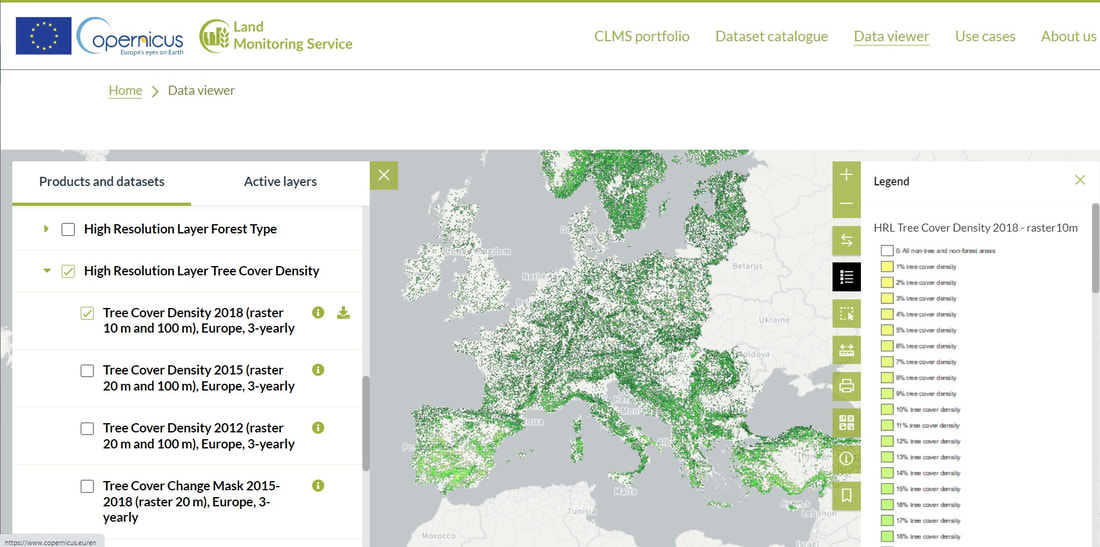
Fig.Tree Cover Density 2018 (raster 10 m and 100 m), Europe, 3-yearly
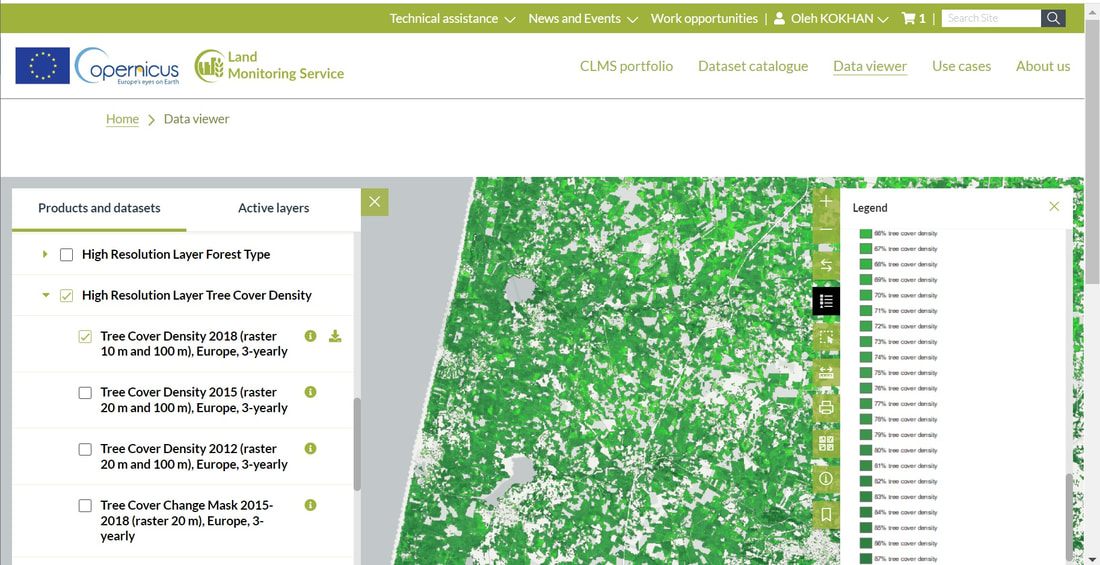
Fig.Tree Cover Density 2018 (raster 10 m and 100 m), Europe, 3-yearly local level
4.Grassland 2015 (raster 20 m and 100 m), Europe, 3-yearly
The main high resolution grassland product is the Grassland layer, a grassland/non-grassland mask for the EEA39. This grassy and non-woody vegetation baseline product includes all kinds of grasslands: managed grassland, semi-natural grassland and natural grassy vegetation. It is a binary status layer for the 2015 reference year mapping grassland and all non-grassland areas in 20m and (aggregated) 100m pixel size and for the 2018 reference year - in 10m and (aggregated) 100m pixel size. The production of the high resolution grassland layers was coordinated by the European Environment Agency (EEA) in the frame of the EU Copernicus programme.
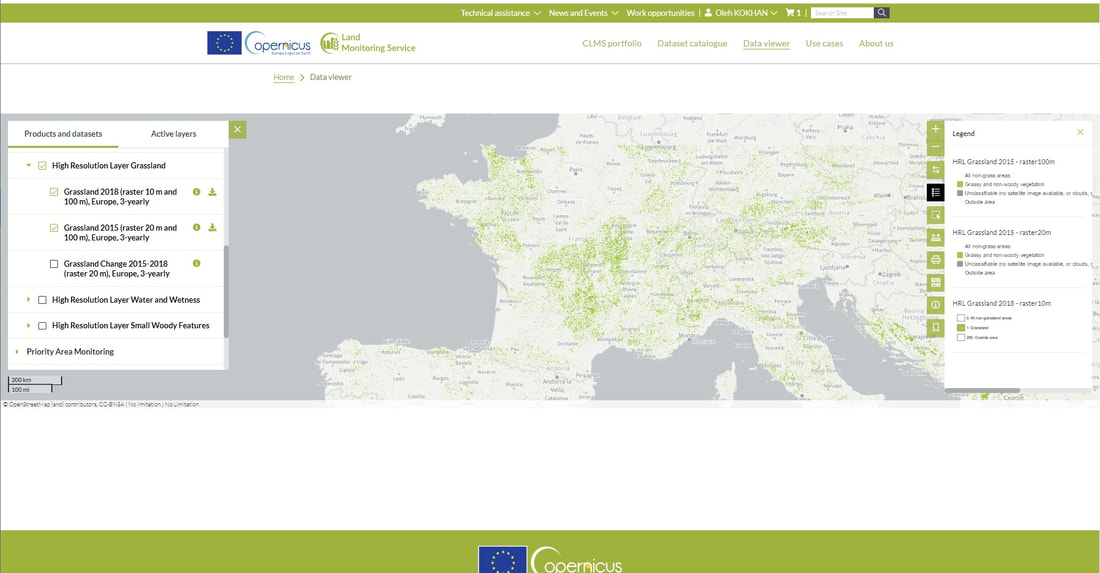
Fig.Grassland 2015 (raster 20 m and 100 m), Europe, 3-yearly. National level.
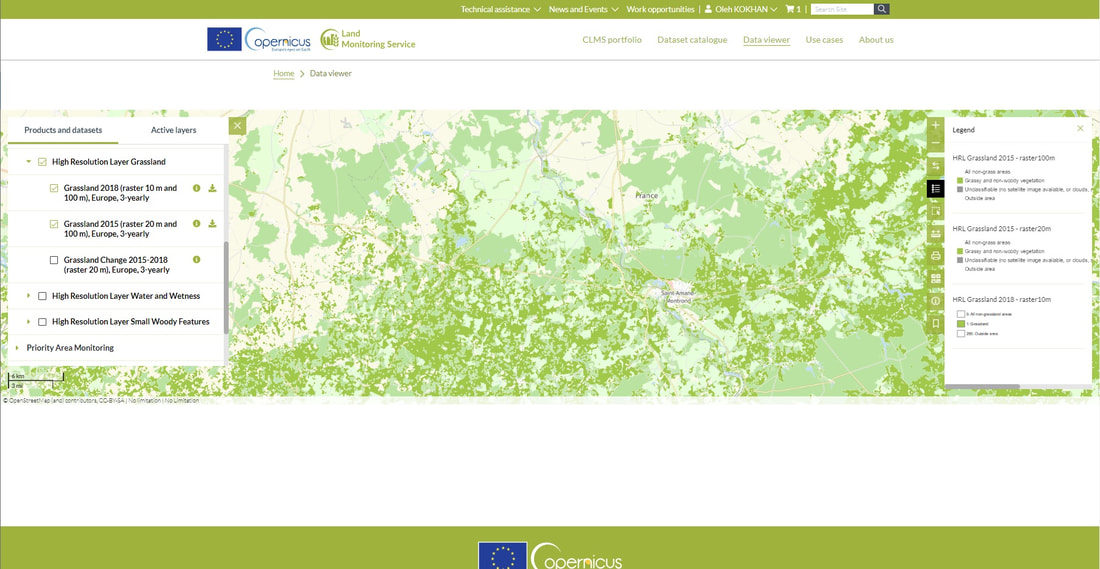
Fig.Grassland 2015 (raster 20 m and 100 m), Europe, 3-yearly. Regional level. France.
Explanations regarding the execution of Task #3
3.1. Copernicus/Copernicus Marine Service/Arctic Sea
The operational TOPAZ5-ECOSMO Arctic Ocean system uses the ECOSMO biological model coupled online to the TOPAZ5 physical model planned for a future update of the ARCTIC_ANALYSIS_FORECAST_PHYS_002_001_a physical forecast. It is run daily to provide 10 days of forecast of 3D biogeochemical variables ocean. The coupling is done by the FABM framework.
Coupling to a biological ocean model provides a description of the evolution of basic biogeochemical variables. The output consists of daily mean fields interpolated onto a standard grid and 40 fixed levels in NetCDF4 CF format.
Variables include 3D fields of nutrients (nitrate, phosphate, silicate), phytoplankton and zooplankton biomass, oxygen, chlorophyll, primary productivity, carbon cycle variables (pH, dissolved inorganic carbon and surface partial CO2 pressure in seawater, carbon export) and light attenuation coefficient.
Surface Chlorophyll-a from satellite ocean colour is assimilated every week and projected downwards using the Uitz et al. (2006) method.
A new 10-day forecast is produced daily using the previous day's forecast and the most up-to-date prognostic forcing fields. Output products have 6.25 km resolution at the North Pole (equivalent to 1/8 deg) on a stereographic projection.
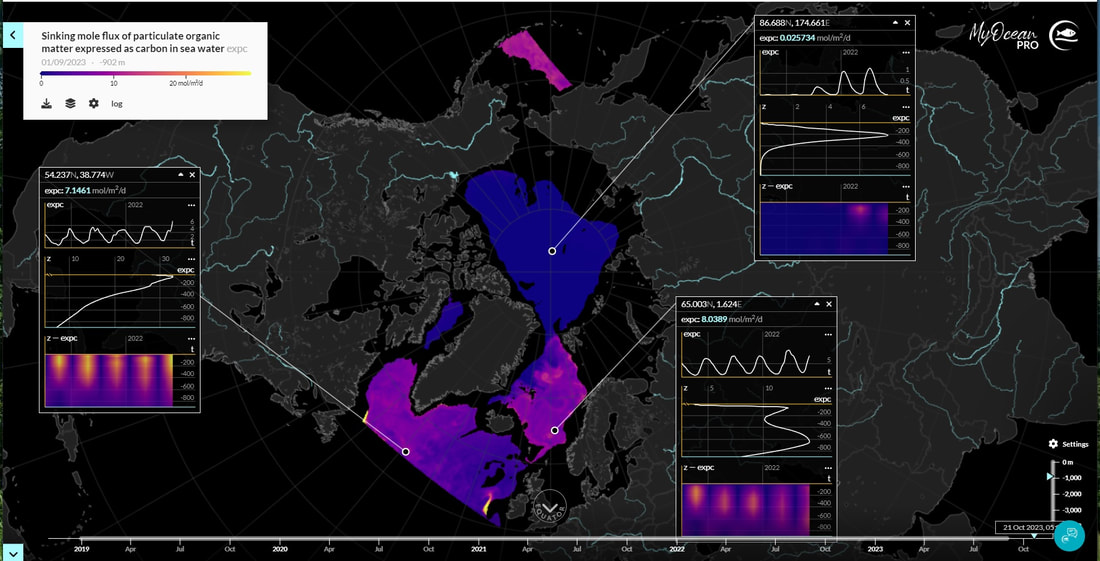
Fig. Evaluation of the variable "Sinking mole flux of particulate organic matter expressed as carbon in sea water ( expc)" in portal Copernicus Marine Service for Arctic Sea
3.2. Copernicus/Copernicus Marine Service/Atlantic: Iberia-Biscay-Ireland
The IBI-MFC provides a high-resolution biogeochemical analysis and forecast product covering the European waters, and more specifically the Iberia–Biscay–Ireland (IBI) area. The last 2 years before now (historic best estimates) as well as daily averaged forecasts with a horizon of 10 days (updated on a weekly basis) are available on the catalogue. To this aim, an online coupled physical-biogeochemical operational system is based on NEMO-PISCES at 1/36° and adapted to the IBI area, being Mercator-Ocean in charge of the model code development. PISCES is a model of intermediate complexity, with 24 prognostic variables. It simulates marine biological productivity of the lower trophic levels and describes the biogeochemical cycles of carbon and of the main nutrients (P, N, Si, Fe). The product provides daily and monthly averages of the main biogeochemical variables: chlorophyll, oxygen, nitrate, phosphate, silicate, iron, ammonium, net primary production, euphotic zone depth, phytoplankton carbon, pH, dissolved inorganic carbon, surface partial pressure of carbon dioxide, and zooplankton.
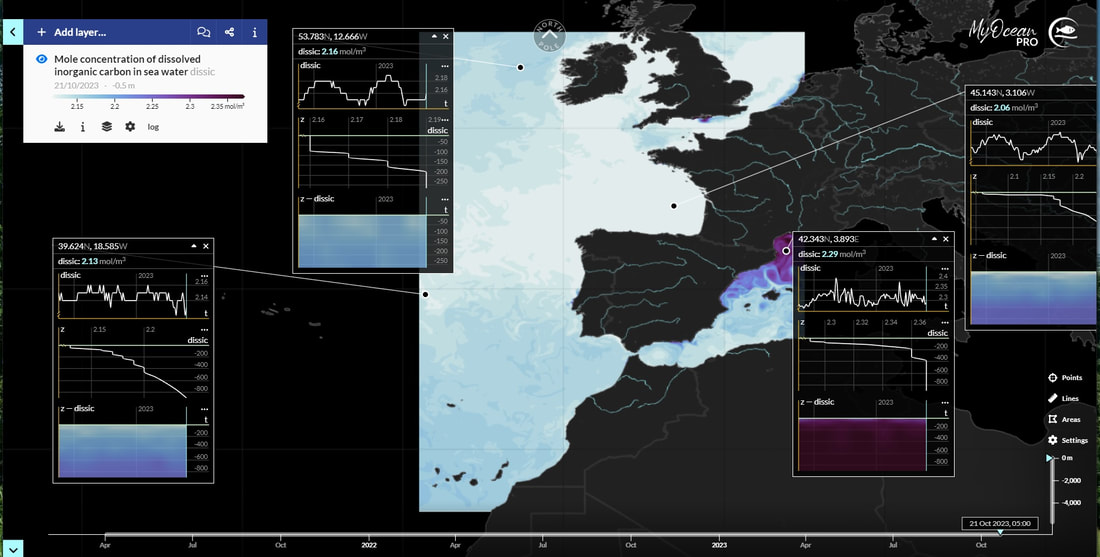
Fig. Evaluation of the variable "Sinking mole flux of particulate organic matter expressed as carbon in sea water ( expc)" in portal Copernicus Marine Service for Atlantic Sea: Iberia-Biscay-Ireland
3.3. Copernicus/Copernicus Marine Service/Atlantic: NW European Shelf
The ocean biogeochemistry analysis and forecast for the North-West European Shelf is produced using the European Regional Seas Ecosystem Model (ERSEM), coupled online to the forecasting ocean assimilation model at 7 km horizontal resolution, NEMO-NEMOVAR. ERSEM (Butenschön et al. 2016) is developed and maintained at Plymouth Marine Laboratory. NEMOVAR system was used to assimilate observations of sea surface chlorophyll concentration from ocean colour satellite data and all the physical variables described in NWSHELF_ANALYSISFORECAST_PHY_LR_004_001. The description of the model and its configuration, including the products validation is provided in the CMEMS-NWS-QUID-004-002. Products are provided as daily 25-hour, de-tided, averages. The datasets available are concentration of chlorophyll, nitrate, phosphate, oxygen, phytoplankton biomass, net primary production, light attenuation coefficient, pH and the partial pressure of CO2. All, as multi-level variables, are interpolated from the model 51 hybrid s-sigma terrain-following system to 24 standard geopotential depths (z-levels). Grid-points near to the model boundaries are masked.
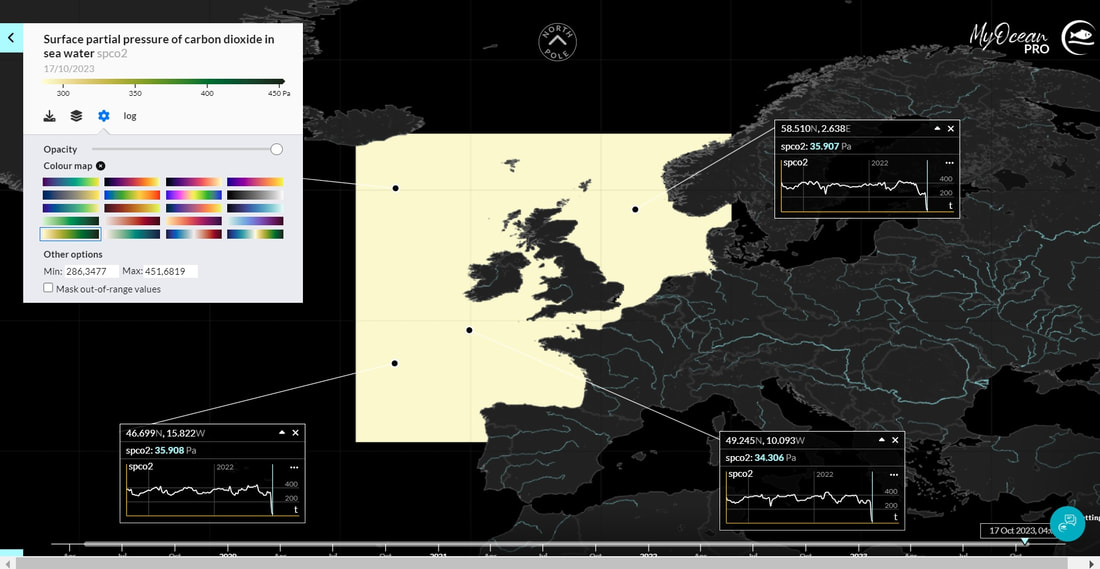
Fig. Evaluation of the variable " Surface partial pressure of carbon dioxide in sea water spco2 " in portal Copernicus Marine Service for Atlantic - European North West Shelf - Ocean Biogeochemistry Analysis and Forecast
3.4.Copernicus/Copernicus Marine Service/Atlantic: North
Data for the Global Ocean Satellite Observations, ACRI-ST company (Sophia Antipolis, France) is providing Bio-Geo-Chemical (BGC) products based on the Copernicus-GlobColour processor.
ClassificationFull name: North Atlantic Ocean Colour Plankton, Reflectance, Transparency and Optics MY L3 daily observations
Product ID OCEANCOLOUR_ATL_BGC_L3_MY_009_113
Spatial extent : Global OceanAtlantic: North Lat 20° to 66°Lon -46° to 13° Spatial resolution 1 × 1 km Temporal extent:Since 4 Sep 1997
Variables: 1.) Mass concentration of chlorophyll a in sea water (CHL) 2.) Secchi depth of sea water (ZSD)Surface ratio of upwelling radiance emerging from sea water to downwelling radiative flux in air 3.) Volume absorption coefficient of radiative flux in sea water due to dissolved organic matter and non algal particles (CDM) 4.) Volume attenuation coefficient of downwelling radiative flux in sea water (KD) 5.) Volume backwards scattering coefficient of radiative flux in sea water due to particles (BBP)
- Upstreams: SeaWiFS, MODIS, MERIS, VIIRS-SNPP & JPSS1, OLCI-S3A & S3B for the ""multi"" products, and S3A & S3B only for the ""olci"" products.
- Variables: Chlorophyll-a (CHL), Primary Production (PP), Phytoplankton Functional types and sizes (PFT), Suspended Matter (SPM), Particulate Backscattering (BBP), Secchi Transparency Depth (ZSD), Diffuse Attenuation (KD490), Absorption Coef. (ADG440/CDM440) and Reflectance (RRS).
- Temporal resolutions: daily, monthly plus, for some variables, daily gap-free based on a space-time interpolation to provide a ""cloud free"" product.
- Spatial resolutions: 4 km (global), 1 km (Atlantic ; 46°W-13°E , 20°N-66°N), and a finer resolution based on olci 300 meters inputs (Atlantic and global coastal).
- Recent products are organized in datasets called Near Real Time (NRT) and long time-series (from 1997) in datasets called Multi-Years (MY).
ClassificationFull name: North Atlantic Ocean Colour Plankton, Reflectance, Transparency and Optics MY L3 daily observations
Product ID OCEANCOLOUR_ATL_BGC_L3_MY_009_113
Spatial extent : Global OceanAtlantic: North Lat 20° to 66°Lon -46° to 13° Spatial resolution 1 × 1 km Temporal extent:Since 4 Sep 1997
Variables: 1.) Mass concentration of chlorophyll a in sea water (CHL) 2.) Secchi depth of sea water (ZSD)Surface ratio of upwelling radiance emerging from sea water to downwelling radiative flux in air 3.) Volume absorption coefficient of radiative flux in sea water due to dissolved organic matter and non algal particles (CDM) 4.) Volume attenuation coefficient of downwelling radiative flux in sea water (KD) 5.) Volume backwards scattering coefficient of radiative flux in sea water due to particles (BBP)
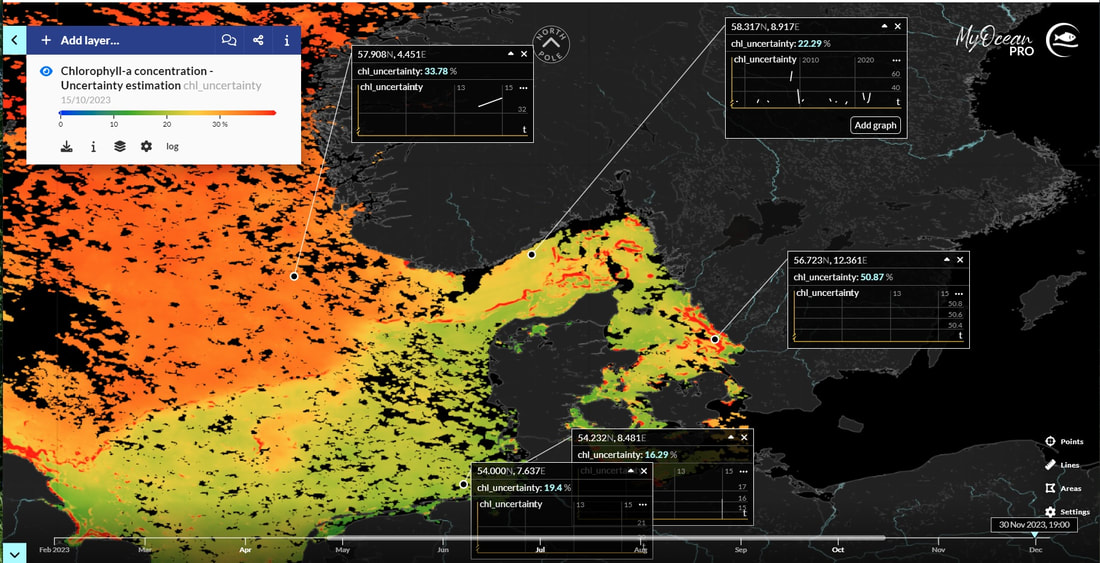
Fig. Evaluation of the variable "Chlorophyll-a concentration - Uncertainty estimation chl_uncertainty" in portal Copernicus Marine Service Biogeochemis North Atlantic Ocean Colour Plankton, Reflectance, Transparency and Optics L3 NRT daily observations.t.ю
Explanations regarding the execution of Task #4
4.1. 4.2 4.3.Copernicus Marine Service
Explanations regarding the execution of Task #4
The Copernicus Marine Service (or Copernicus Marine Environment Monitoring Service) is the marine component of the Copernicus Programme of the European Union. It provides free, regular and systematic authoritative information on the state of the Blue (physical), White (sea ice) and Green (biogeochemical) ocean, on a global and regional scale. It is funded by the European Commission (EC) and implemented by Mercator Ocean International. It is designed to serve EU policies and International legal Commitments related to Ocean Governance, to cater for the needs of society at large for global ocean knowledge and to boost the Blue Economy across all maritime sectors by providing free-of-charge state-of-the-art ocean data: services, products, models and variables and information.
This product corresponds to a REP L4 time series of monthly global reconstructed surface ocean pCO2, air-sea fluxes of CO2, pH, total alkalinity, dissolved inorganic carbon, saturation state with respect to calcite and aragonite, and associated uncertainties on a 1° x 1° regular grid. The product is obtained from an ensemble-based forward feed neural network approach mapping situ data for surface ocean fugacity (SOCAT data base, Bakker et al. 2016, https://www.socat.info/) and sea surface salinity, temperature, sea surface height, chlorophyll a, mixed layer depth and atmospheric CO2 mole fraction. Sea-air flux fields are computed from the air-sea gradient of pCO2 and the dependence on wind speed of Wanninkhof (2014). Surface ocean pH on total scale, dissolved inorganic carbon, and saturation states are then computed from surface ocean pCO2 and reconstructed surface ocean alkalinity using the CO2sys speciation software.
This product corresponds to a REP L4 time series of monthly global reconstructed surface ocean pCO2, air-sea fluxes of CO2, pH, total alkalinity, dissolved inorganic carbon, saturation state with respect to calcite and aragonite, and associated uncertainties on a 1° x 1° regular grid. The product is obtained from an ensemble-based forward feed neural network approach mapping situ data for surface ocean fugacity (SOCAT data base, Bakker et al. 2016, https://www.socat.info/) and sea surface salinity, temperature, sea surface height, chlorophyll a, mixed layer depth and atmospheric CO2 mole fraction. Sea-air flux fields are computed from the air-sea gradient of pCO2 and the dependence on wind speed of Wanninkhof (2014). Surface ocean pH on total scale, dissolved inorganic carbon, and saturation states are then computed from surface ocean pCO2 and reconstructed surface ocean alkalinity using the CO2sys speciation software.
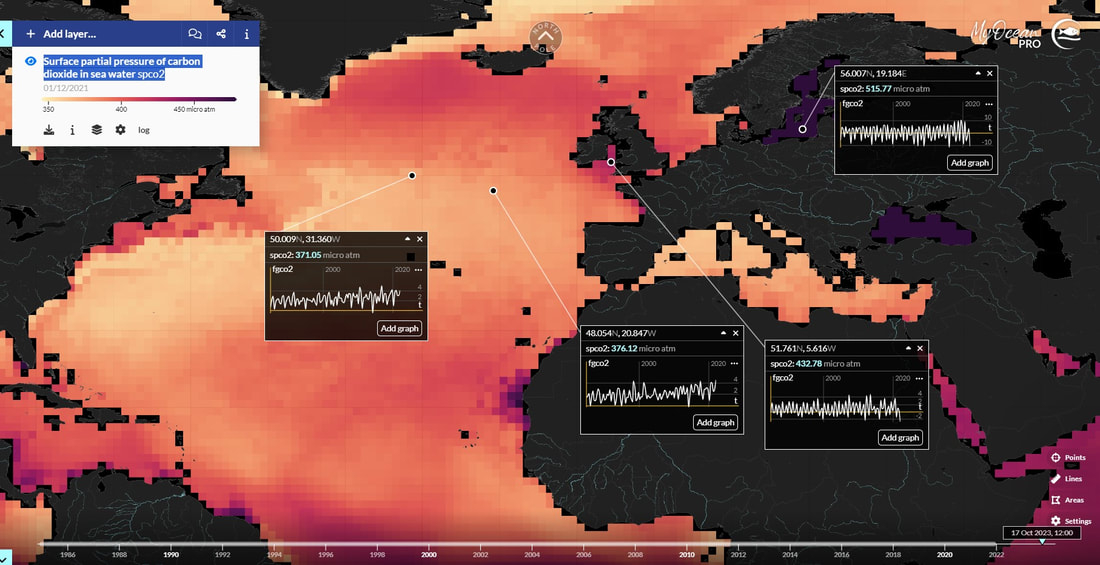
Fig. Assessment for variable "Surface partial pressure of carbon dioxide in sea water spco2/Global Ocean Surface Carbon/Copernicus Marine Service".
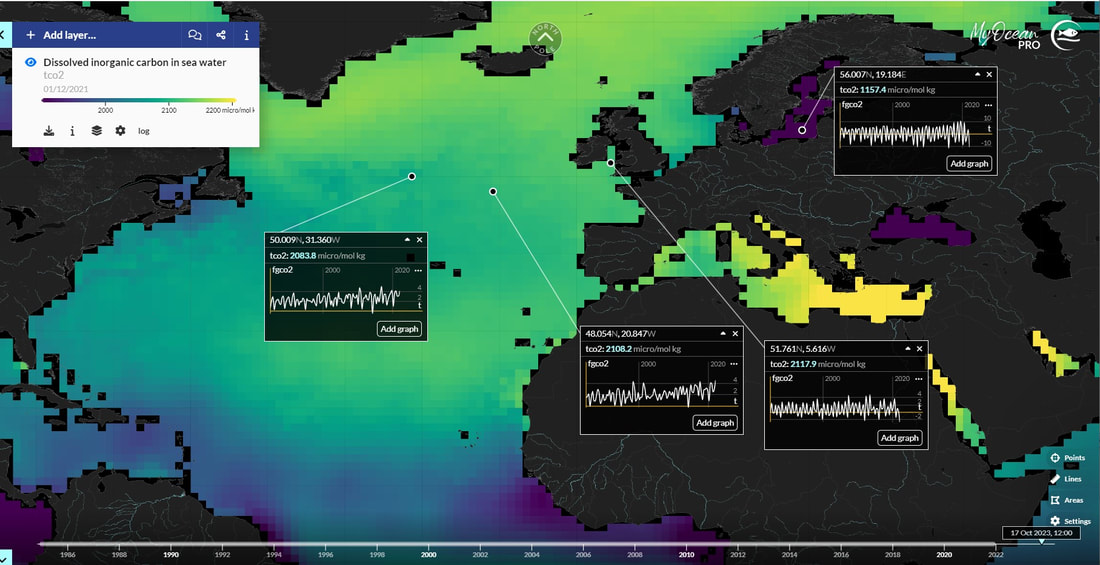
Fig. Assessment for variable "Dissolved inorganic carbon in sea water tco2./Global Ocean Surface Carbon/Copernicus Marine Service".
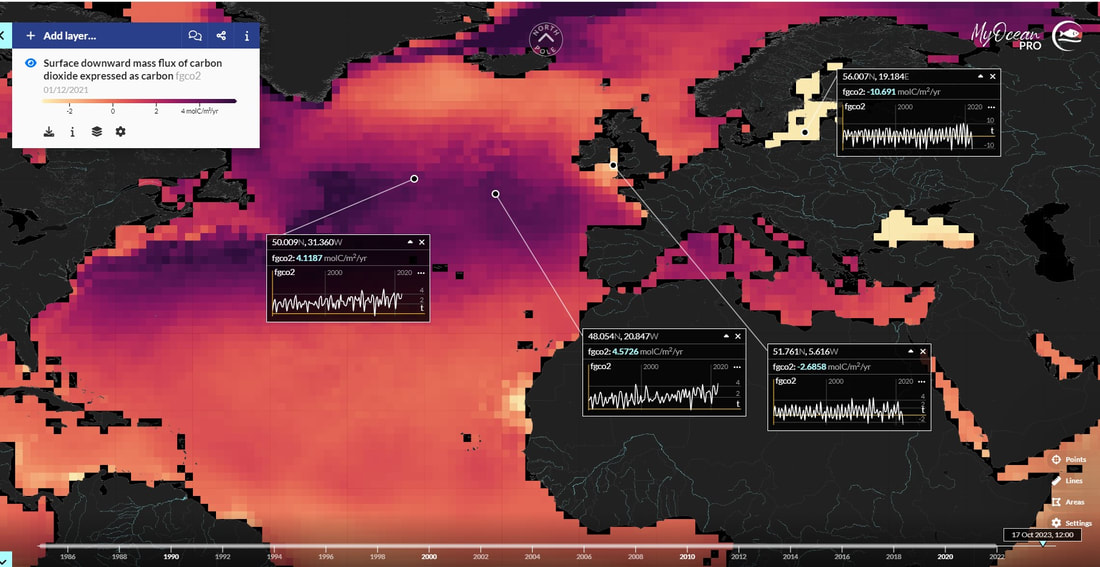
Fig. Assessment for variable"Surface downward mass flux of carbon dioxide expressed as carbon fgco2/Global Ocean Surface Carbon/Copernicus Marine Service".
4.4. 4.5 4.6. Copernicus Land Service/ Coastal Zones Land Cover/Land Use 2018 (vector), Europe, 6-yearly
The Coastal Zones (CZ) LC/LU product for 2018 is providing a detailed Land Cover / Land Use (LC/ LU) dataset for areas along the coastline of the EEA38 countries and the United Kingdom, with reference year 2018 for the classification. This product monitors landscape dynamics in European coastal territory to an inland depth of 10 km with a total area of approximately 730,000 km², with all the relevant areas (estuaries, coastal lowlands, nature reserves). The production of the coastal zone layers was coordinated by the European Environment Agency (EEA) in the frame of the EU Copernicus programme, as part of the Copernicus Land Monitoring Service (CLMS) Local Component.
The Coastal Zones product covers a buffer zone of coastline derived from EU-Hydro v1.1. Land Cover/Land Use (LC/LU) layer is extracted from Very High Resolution (VHR) satellite data and other available data. The class definitions follow the pre-defined nomenclature on the basis of Mapping and Assessment of Ecosystems and their Services (MAES) typology of ecosystems (Level 1 to Level 4) and CORINE Land Cover adapted to the specific characteristics of coastal zones. The classification provides 71 distinct thematic classes with a Minimum Mapping Unit (MMU) of 0.5 ha and a Minimum Mapping Width (MMW) of 10 m. The product is available for the 2012 and 2018 reference year including change mapping.
The Coastal Zones product covers a buffer zone of coastline derived from EU-Hydro v1.1. Land Cover/Land Use (LC/LU) layer is extracted from Very High Resolution (VHR) satellite data and other available data. The class definitions follow the pre-defined nomenclature on the basis of Mapping and Assessment of Ecosystems and their Services (MAES) typology of ecosystems (Level 1 to Level 4) and CORINE Land Cover adapted to the specific characteristics of coastal zones. The classification provides 71 distinct thematic classes with a Minimum Mapping Unit (MMU) of 0.5 ha and a Minimum Mapping Width (MMW) of 10 m. The product is available for the 2012 and 2018 reference year including change mapping.
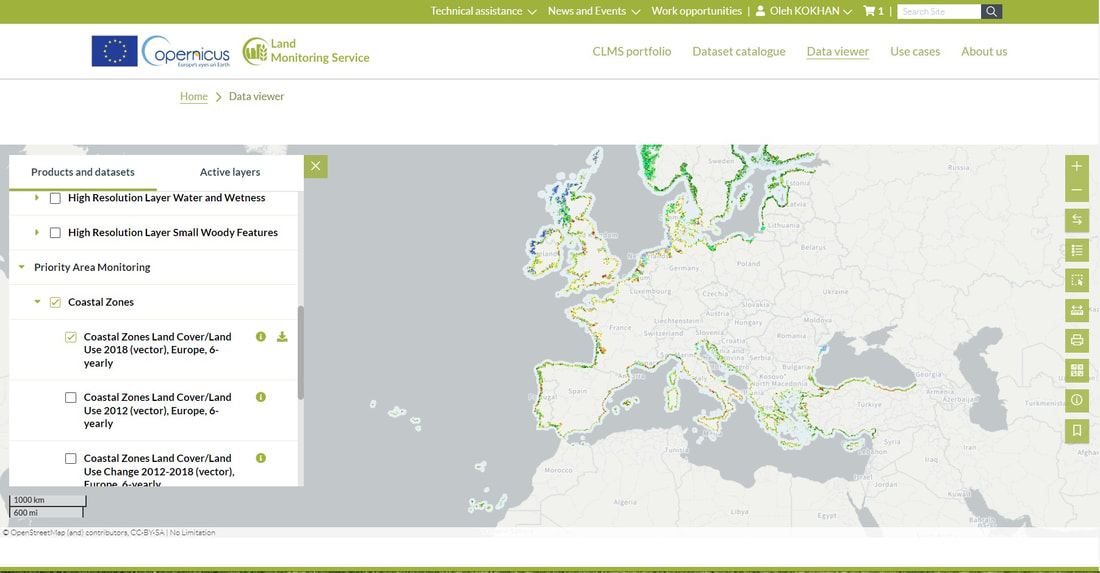
Fig. Information on Coastal Zones Land Cover 2018 (vector), Europe, 6-yearly. Provides a detailed land cover and land use change information for 71 thematic classes for areas along the European coastline between the 2012 and 2018 reference years on the regional level.
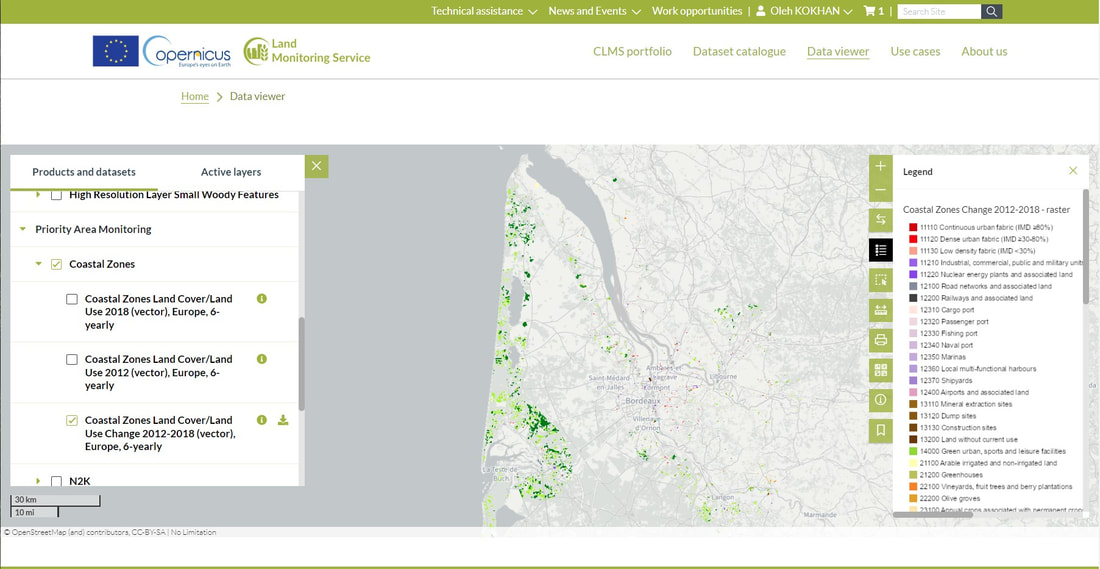
Fig. Detailed land cover and land use information for 71 thematic classes for areas along the European coastline for the 2018 reference year. The dataset has a Minimum Mapping Unit (MMU) of 0.5 ha and a Minimum Mapping Width (MMW) of 10 m and is available as vector data.
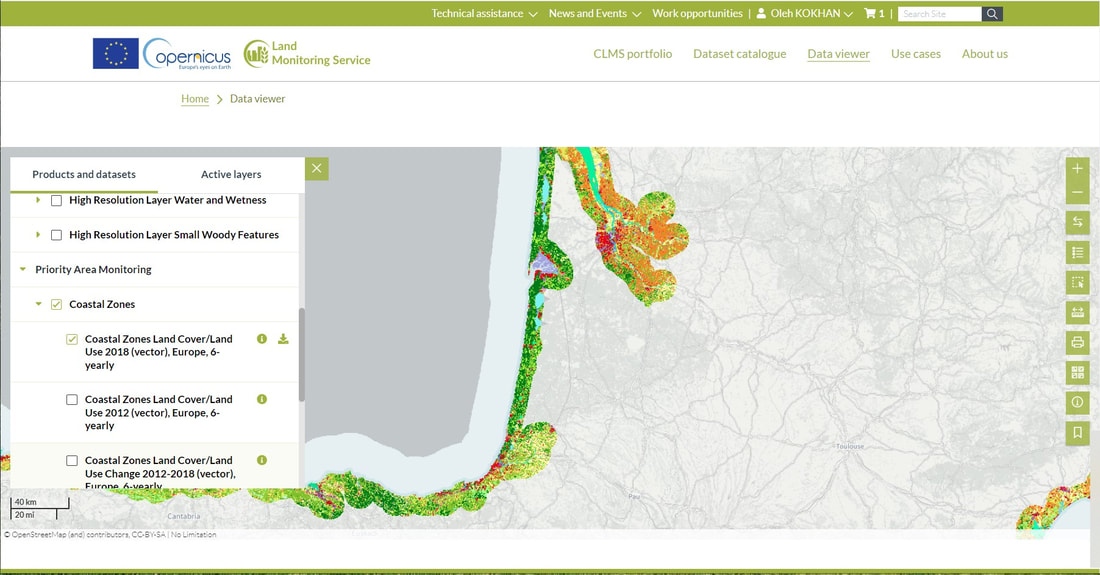
Fig. Information on Coastal Zones Land Cover/Land Use Change 2012-2018 (vector), Europe, 6-yearly.Provides a detailed land cover and land use change information for 71 thematic classes for areas along the European coastline between the 2012 and 2018 reference years. The dataset has a Minimum Mapping Unit (MMU) of 0.5 ha and a Minimum Mapping Width (MMW) of 10 m and is available as vector data.
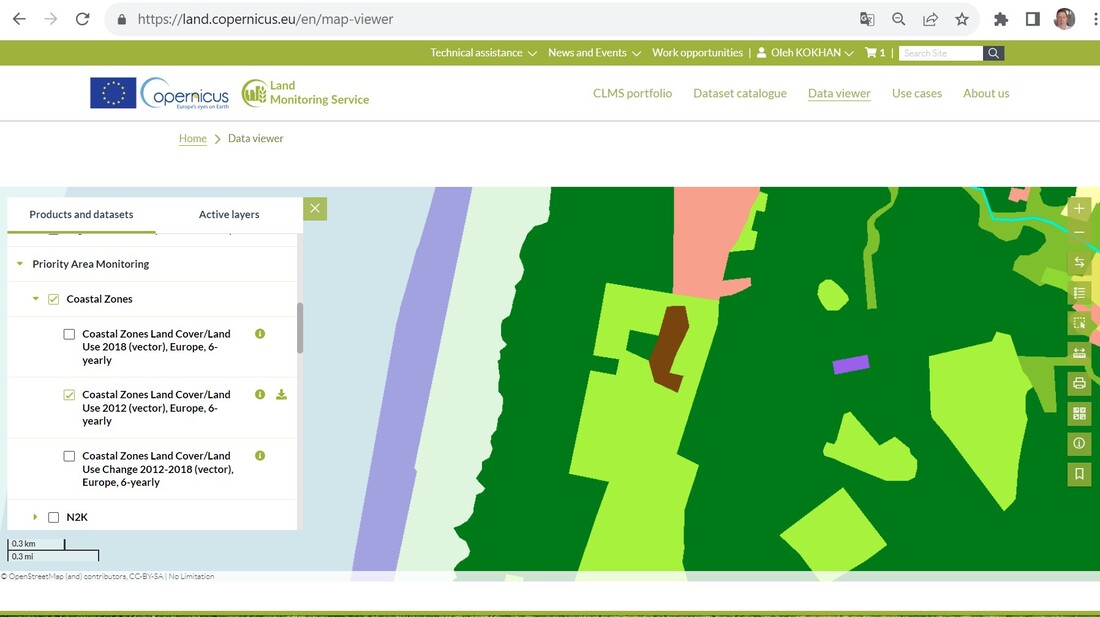
Fig.Coastal Zones Land Cover/Land Use 2012 (vector), Europe, 6-yearly
Provides a detailed land cover and land use information for 71 thematic classes for areas along the European coastline for the 2012 reference year. The dataset has a Minimum Mapping Unit (MMU) of 0.5 ha and a Minimum Mapping Width (MMW) of 10 m and is available as vector data. Validation status |
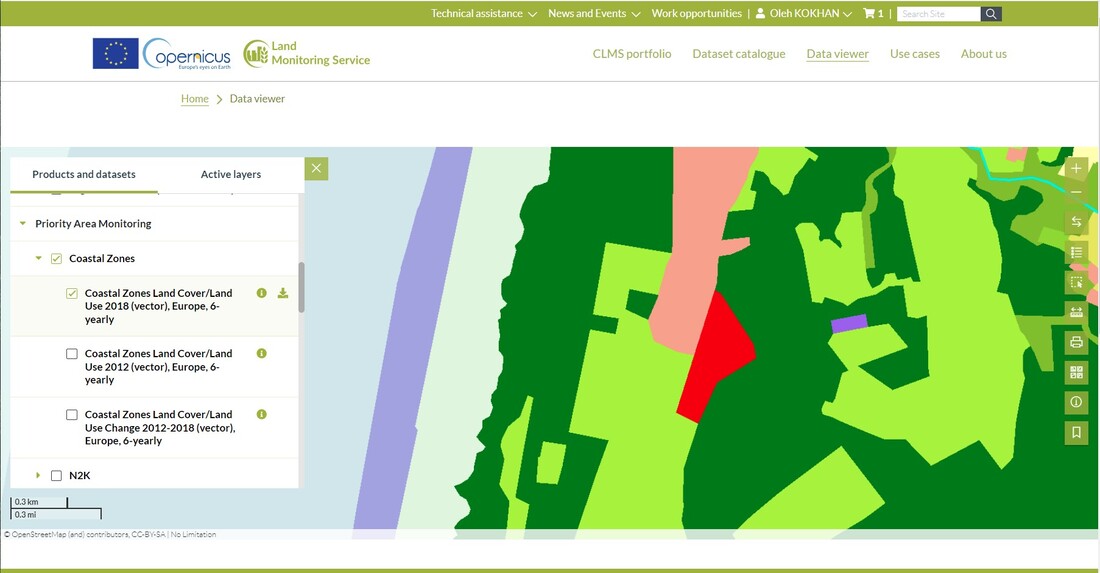
Fig.Coastal Zones Land Cover/Land Use 2018 (vector), Europe, 6-yearlyProvides a detailed land cover and land use information for 71 thematic classes for areas along the European coastline for the 2018 reference year. The dataset has a Minimum Mapping Unit (MMU) of 0.5 ha and a Minimum Mapping Width (MMW) of 10 m and is available as vector data. |
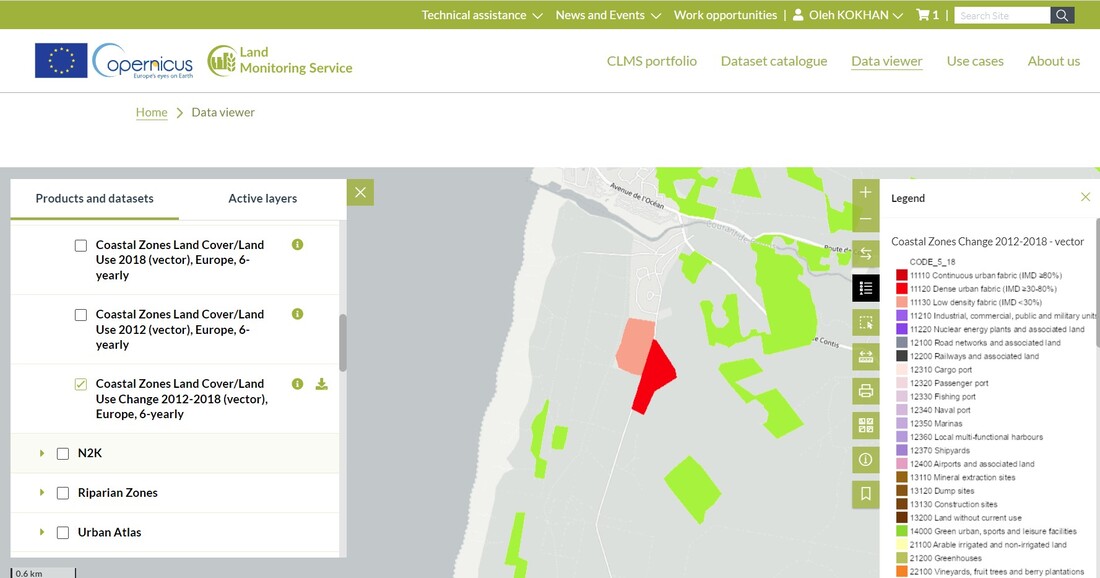
Fig. Coastal Zones Land Cover/Land Use Change 2012-2018 (vector), Europe, 6-yearly
Provides a detailed land cover and land use change information for 71 thematic classes for areas along the European coastline between the 2012 and 2018 reference years on the regional and local lever.
Provides a detailed land cover and land use change information for 71 thematic classes for areas along the European coastline between the 2012 and 2018 reference years on the regional and local lever.
Results:
1. Assessments were made from the reported GHG data from UNFCCC for LULUCF: data and corresponding values of GHG absorption from land use, land use change and forestry (LULUCF) for the possibility of integration into Copernicus services using the NUTS system.
2. Measurement of the parameters and their corresponding values defined in the Copernicus service for their proportionality and compliance using the NUTS classification system with GHG data from UNFCCC using NUTS classification to identify their connections and data integration: carbon stocks and related emissions and absorption with and without LULUCF;
3. Little-known parameters for greenhouse gas data are proposed for research with the application of their products of Copernicus services data to prepare for the study of new assessment methods and the development of greenhouse gas monitoring with existing datasets for the entire EU;
4. Reconciliation of data by year between GHG data from UNFCCC and long-term time data received in Copernicus services using new products that are correlated and adjusted with the values of emissions and absorption of greenhouse gases and carbon.
